How to Read Your DEXA Scan Results
Curious to know what your DEXA results will look like? A typical DEXA scan report provides comprehensive insights into your bone mineral density and body composition. Here’s an overview of what you might find in a sample report.
Please note: Nomad Fit Lab is not a medical facility or practitioner. The data in our reports is for informational purposes only and should not be used for medical diagnosis. For any concerns, please consult your physician.
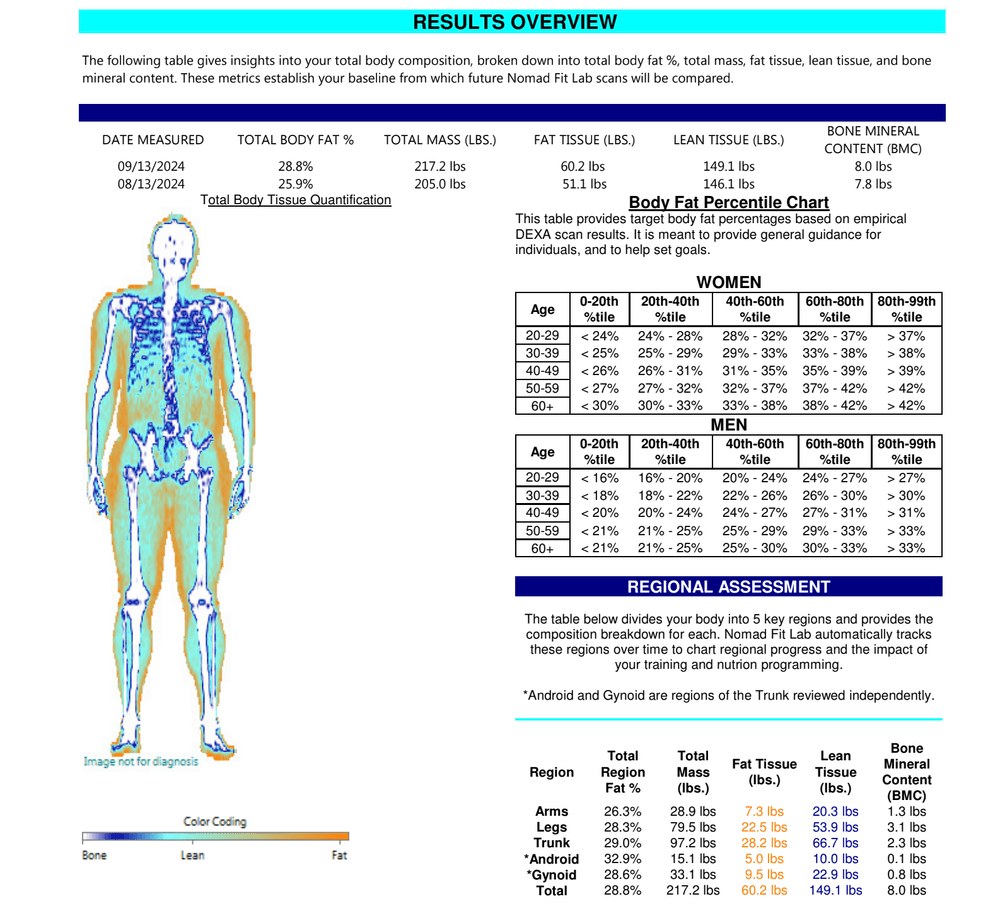
Results Overview (Page 1)
The Results Overview gives insights into your total body composition, broken down into Total Body Fat Percent, Total Mass, Fat Tissue, Lean Tissue, and Bone Mineral Content.
- Total Mass: Weight of your body assessed by the DEXA scanner.
- Fat Tissue: Total amount of fat mass (weight in pounds) in your whole body.
- Lean Tissue: Non-fat tissue including muscles, organs, ligaments, and tendons.
- Bone Mineral Content (BMC): Mass of bone minerals across the whole body.
- Total Body Fat %: Percentage of your body made up of fat.
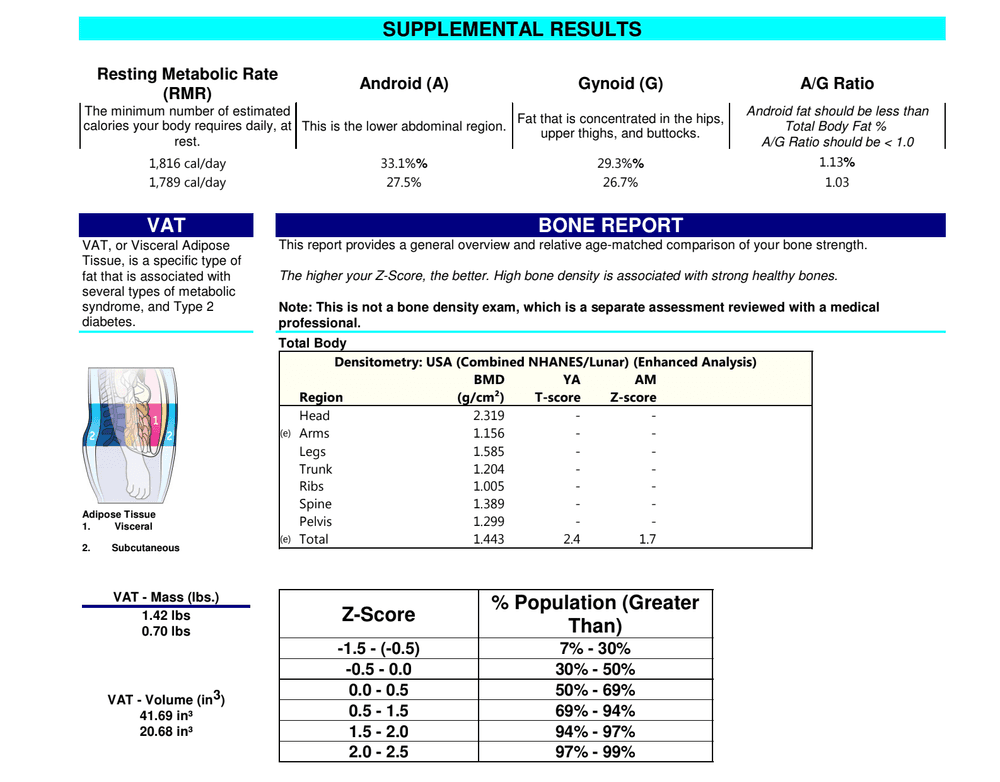
Supplemental Results (Page 2)
The Supplemental Results report gives insights on your Resting Metabolic Rate (RMR), Visceral Adipose Tissue (VAT), Fat Distribution by region, and a general overview and relative age-matched comparison of your Bone Strength.
- Resting Metabolic Rate: Estimate of calories required by your body per day, at rest.
- Android (Region of body): Lower abdominal region.
- Gynoid (Region of body): Fat that is concentrated in the hips, upper thighs, and buttocks.
- A/G Ratio (Android over Gynoid Ratio): Ratio used to assess risk of complications due to higher amounts of abdominal fat (Android) than hip, thigh, and buttocks fat (Gynoid). Gynoid fat is normally less of a concern, fat around the abdominals and organs is not ideal.
- VAT (Visceral Adipose Tissue): Specific type of fat that sits behind the abdominals on the internal organs and is assessed for risk of developing type 2 diabetes or fatty liver.
- Z-Score (Bone Density Score): Age adjusted (population adjusted) score to give insight into bone health, and potential risks for osteoporosis, and osteopenia.
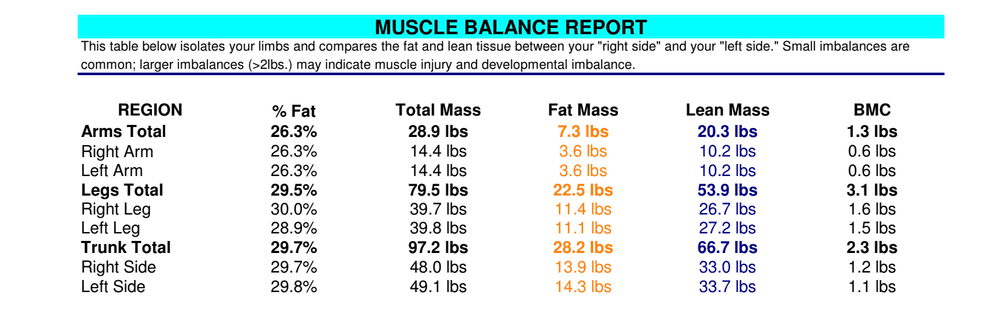
Muscle Balance Report (Page 3)
The Muscle Balance Report isolates your limbs and compares the fat and lean tissue between your right side and left side. Nomad Fit Lab’s report breaks the body down into “regions” which are:
- Arms (left and right): These are our arms, when the person being scanned fits within the rectangle entirely they will get their left and right arm differences measured by the DEXA. People with dominant arms at times will see they have more muscle and fat in that arm vs. the less dominant arm. Damage to arms (breaks, sprains, etc.) might even lead to lower muscle mass and fat in that limb.
- Legs (left and right): These are our legs, they too are shown as left vs. right in our report. Again, dominant or damaged legs can result in imbalances in muscle and fat mass.
- Trunk (left and right): This is our torso, it too will have a left vs. right side in our report. Again, dominant or damaged sides can result in imbalances in muscle and fat mass.
- Android: Lower abdominals, measured for fat distribution and the A/G ratio.
- Gynoid: Upper thighs, hips, buttocks, measured for fat distribution and the A/G ratio.
- BMC – Bone Mineral Content: Bone mineral mass across the whole body.
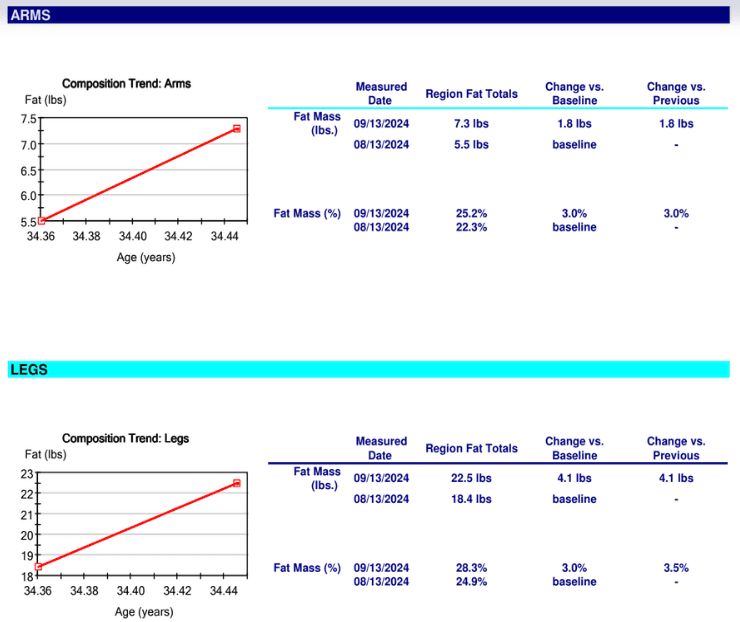
Regional Fat Tissue Report (Pages 4-6)
The Regional Fat Tissue Report shows how fat quantity in different regions of your body have changed over time.
- Our report will tell the person: how much fat they lost/gained/did not change since their last scan.
- These pages are for trends built by getting more than a single scan with Nomad Fit Lab.
- The line graph includes all scans, ever, and will show the person’s fat tissue changes over time of their life in years.
- The table to the right of the line graph is showing you two things, Fat Mass in pounds, and Fat Mass in percentages. Those will always have a person’s “baseline” which is their first visit’s data.
- A person will see how much change in pounds and percentages in that table to the right of the line graph.
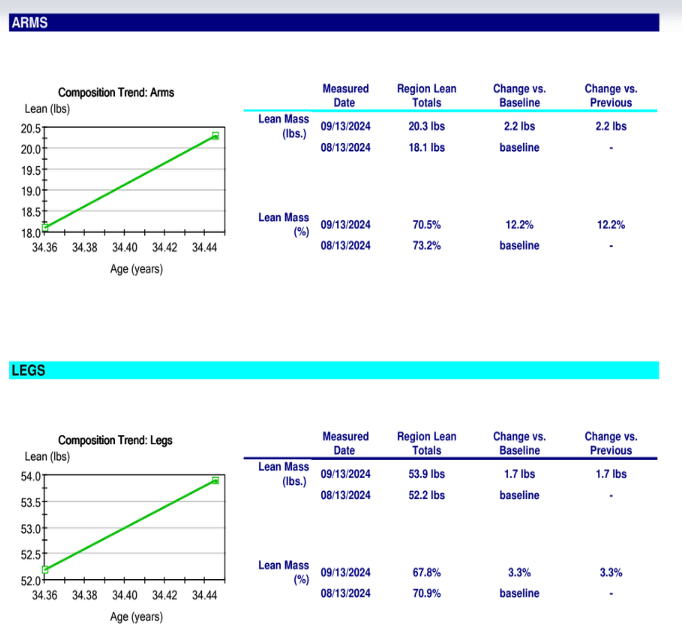
Regional Lean Tissue Report (Pages 7-9)
The Regional Lean Tissue Report shows how lean tissue in different regions of your body have changed over time.
- Our report will tell the person: how much lean tissue they lost/gained/did not change since their last scan.
- These pages are for trends built by getting more than a single scan with Nomad Fit Lab.
- The line graph includes all scans, ever, and will show the person’s lean tissue changes over time of their life in years.
- The table to the right of the line graph is showing you two things, Lean Mass in pounds, and Lean Mass in percentages. Those will always have a person’s “baseline” which is their first visit’s data.
- A person will see how much change in pounds and percentages in that table to the right of the line graph.
What do I do with my results after my DEXA scan?
The answer to this question will be unique to each person’s own health and wellness goals. Understanding your DEXA results empowers you to make informed decisions about your health and wellness. If you are concerned about bone health, you can take your results to your physician to review the report and establish a plan around your bone health. Many people will use our baseline report to begin, or modify, their training and diet plans. Some will take this an opportunity to engage with a dietician, nutritionist, or personal trainer to make the most of their efforts and time spent in the gym and planning their meals. We encourage you to schedule your next DEXA scan with Nomad Fit Lab today.
Ready to see your own numbers?
Book a mobile DEXA scan at a gym or studio near you. Under 15 minutes, results in your inbox the same day.